
- Advertisement -
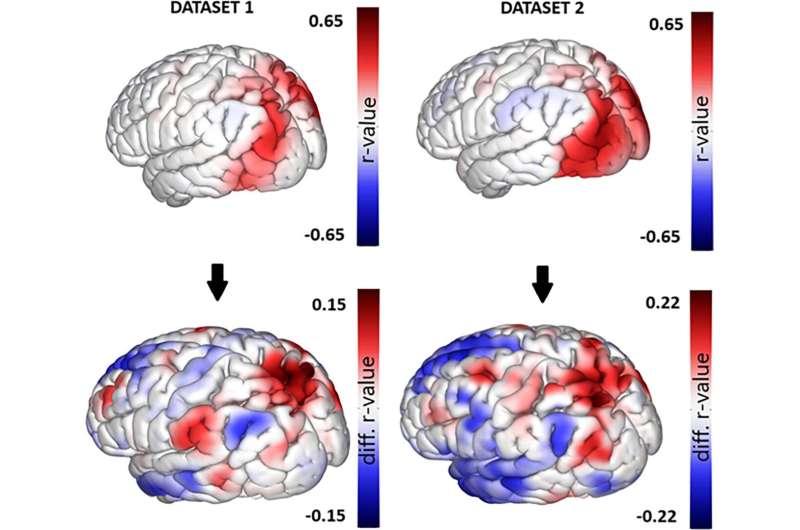
Brain abnormalities seen in military members with blast exposure
- Advertisment -

The Australian Online News Network acknowledges the traditional custodians of country throughout Australia and their connections to land, sea and community. We pay our respect to their elders past and present and extend that respect to all Aboriginal and Torres Strait Islander peoples today.
